API
Overview
The idea for this code came from my time managing a team of data analysts for an internal audit department of a large company.
The audit team asks the business for certain data and, depending on the prevailing politics of the organization, may eventually receive such data or the permission necessary to extract it.
So, now you’ve got potentially a lot of data … where do you tell your auditors to focus? Wouldn’t it be helpful to have a program which quickly identifies interesting things? And by interesting I mean either likely incorrect, or likely correct but pointing to a business failure.
That’s what this program does.
What this program does not do
This is not artificial intelligence or machine learning. It is useful statistics which allows a subject-matter expert, or even a well-read person, to quickly spot potential anomalies in a set of data which is otherwise too large to comprehend.
The anomalies can be incorrect measurements or evidence of a process which is not working as designed or expected. Follow-up, in the form of questions to the data producer, or to the owner or administrator of the underlying process, will likely be required.
Usage
Installation
git clone https://github.com/jsf80238/data_profiling.gitcd data_profilingpython3 -m venv your_dirsource your_dir/bin/activate# or on Windowsyour_dir\Scripts\activate.batpip install -r requirements.txt
Data preparation
CSV file
Download to a suitable location.
Database
The program will theoretically support any database with a JDBC driver. PostgreSQL and Microsoft SQL drivers are included. To support another database:
Download the JDBC driver to
data_profiling/lib/jars.Edit
config\config.yaml:Add the port number.
Add the JDBC class name.
Add the name of the JDBC jar file.
Add the connection string.
Environment file
You can store your connection credentials in a file or provide them via the command-line.
$ cat /tmp/env

HOST_NAME=localhost

PORT_NUMBER=1433
DATABASE_NAME=master
USER_NAME=sa
PASSWORD=your-password

# PORT_NUMBER=5432
# DATABASE_NAME=example
# USER_NAME=postgres
# PASSWORD=your-password
Execution
$ export PYTHONPATH="data_profiling:"  # PowerShell:  $env:PYTHONPATH="data_profiling;"

$ python data_profiling/profile-data.py -h
usage: profile-data.py [-h] [--db-host-name HOST_NAME] [--db-port-number PORT_NUMBER]
                       [--db-name DATABASE_NAME] [--db-user-name USER_NAME]
                       [--db-password PASSWORD] [--environment-file /path/to/file]
                       [--header-lines NUM] [--sample-rows-file NUM]
                       [--max-detail-values NUM] [--max-pattern-length NUM]
                       [--output-dir /path/to/dir] [-v | -t]
                       /path/to/input_data_file.csv | query-against-database

Profile the data in a database or CSV file. Generates an analysis consisting of an Excel
workbook and (optionally) one or more images. For string columns provides a pattern
analysis with C replacing letters, 9 replacing numbers, underscore replacing spaces, and
question mark replacing everything else.

positional arguments:
  /path/to/input_data_file.csv | query-against-database

options:
  -h, --help            show this help message and exit
  --db-host-name HOST_NAME
                        Overrides HOST_NAME environment variable. Ignored when getting data
                        from a file.
  --db-port-number PORT_NUMBER
                        Overrides PORT_NUMBER environment variable. Ignored when getting
                        data from a file.
  --db-name DATABASE_NAME
                        Overrides DATABASE_NAME environment variable. Ignored when getting
                        data from a file.
  --db-user-name USER_NAME
                        Overrides USER_NAME environment variable. Ignored when getting data
                        from a file.
  --db-password PASSWORD
                        Overrides PASSWORD environment variable. Ignored when getting data
                        from a file.
  --environment-file /path/to/file
                        An additional source of database connection information. Overrides
                        environment settings.
  --header-lines NUM    When reading from a file specifies the number of rows to skip for
                        header information. Ignored when getting data from a database.
                        Default is 0. (must be in range 1..=9223372036854775807)
  --sample-rows-file NUM
                        When reading from a file randomly choose this number of rows. If
                        greater than or equal to the number of data rows will use all rows.
                        Ignored when getting data from a database. (must be in range
                        1..=9223372036854775807)
  --max-detail-values NUM
                        Produce this many of the top/bottom value occurrences, default is
                        35. (must be in range 1..=9223372036854775807)
  --max-pattern-length NUM
                        When segregating strings into patterns leave untouched strings of
                        length greater than this, default is 50. (must be in range
                        1..=9223372036854775807)
  --output-dir /path/to/dir
                        Default is the current directory. Will make intermediate
                        directories as necessary.
  -v, --verbose
  -t, --terse
A note about sampling
If your task is to write code which ETLs account data for a financial institution then sampling may not be an option … your code needs to handle every source row it encounters.
For analysis tasks, though, the Central Limit Theorem provides really useful results from what intuitively may seem like a small amount of data. See my StackExchange question for a discussion.
How to specify sampling
CSV file
Use the
--sample-rows-fileoption. This will be an absolute number, rather than a percentage, because the confidence interval for a sample is based on the absolute number of rows, not the size of the population. If your file contains fewer rows than the number you specify the program will just analyze every row.
Database
Use your database’s sampling keyword.
For PostgreSQL see
TABLESAMPLEandtsm_system_rows.For Microsoft SQL see
TABLESAMPLE.
Examples
# CSV file
$ python data_profiling/profile-data.py /path/to/data.csv

# CSV file, no more than 10,000 rows, set the output directory
$ python data_profiling/profile-data.py --samp=10000 --out=/path/to/a/dir /path/to/data.csv

# Database with connection information in command line
$ python data_profiling/profile-data.py --db-host=https://domain.com --db-port=5432 \
--db-name my_database --db-user=me --db-pass=my_password \
"select * from schema_name.table_name where columnA = 3"

# Database with more-than-default detail values and connection information in an environment file
$ python data_profiling/profile-data.py --max-detail=40 --env=/path/to/env/file \
"select columnA, columnC, columnJ from table_name"
Example results for restaurant data
The results will be an .zip archive in your current directory.
The results posted below are based on Los Angeles restaurant inspection data I downloaded from https://www.kaggle.com. The URL at that time was https://www.kaggle.com/datasets/cityofLA/la-restaurant-market-health-data.
The program generates a zip file containing:
Excel workbook containing multiple sheets:
Summary.
A detail analysis sheet and a pattern analysis sheet for each string column in the data source.
Distribution plots for each date and numeric column in the data source.
This is an example summary:
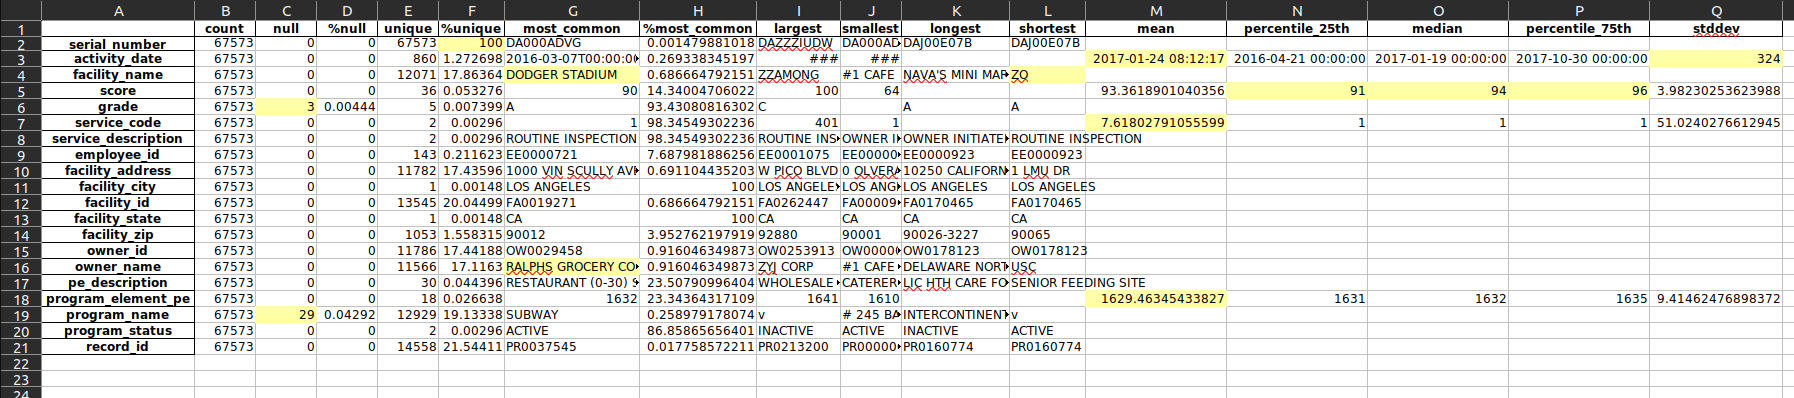 Let’s focus on the highlighted cells.
C6, C19: these are likely data quality issues. As a percentage of the total data set can be ignored.
F2:
serial_numberis unique. Good.G4: The most common
facility_namefor restaurants is “DODGER_STADIUM”. That’s odd.G16: And yet the most common
owner_nameis Ralph’s Grocery CO. Probably https://www.ralphs.com/.L4: The shortest
facility_nameis “ZO”. Probably a data quality issue.M3, Q3: Dates are treated as numeric. They can essentially be thought of as the number of seconds after some date. See also https://www.epochconverter.com/ for Linux. Windows has a similar concept.
N5, O5, P5: 50% of the scores were between 91 and 96.
M7, M18: the program treats numbers as measurements, even though for these columns the numbers are just IDs. Perhaps more sophisticated code could do better.
Now, details by column.
score
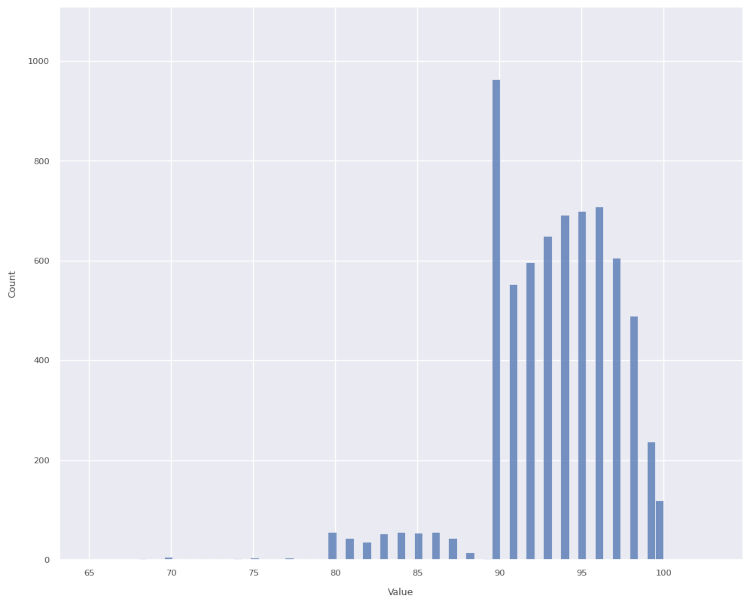
As a first estimate I would have guessed this would look like a Bell curve, perhaps with a bit of skew.
Instead, we many more scores of 90 than expected and much fewer scores of 89 than expected (and fewer in the 80s than expected).
Without proof I would guess:
A score of 90-100 yields a sign in the restaurant window with the letter A.
A score of 80-89 yields a sign in the restaurant window with the letter B.
People don’t like to eat at restaurants which fail to achieve an A-rating.
Restaurant owners, and to a lesser extent restaurant inspectors, strive to avoid anything other than an A-rating. (Image below courtesy of https://la.eater.com/2015/8/19/9178907/la-county-health-department-restaurant-grades-need-overhaul.)

employee_id
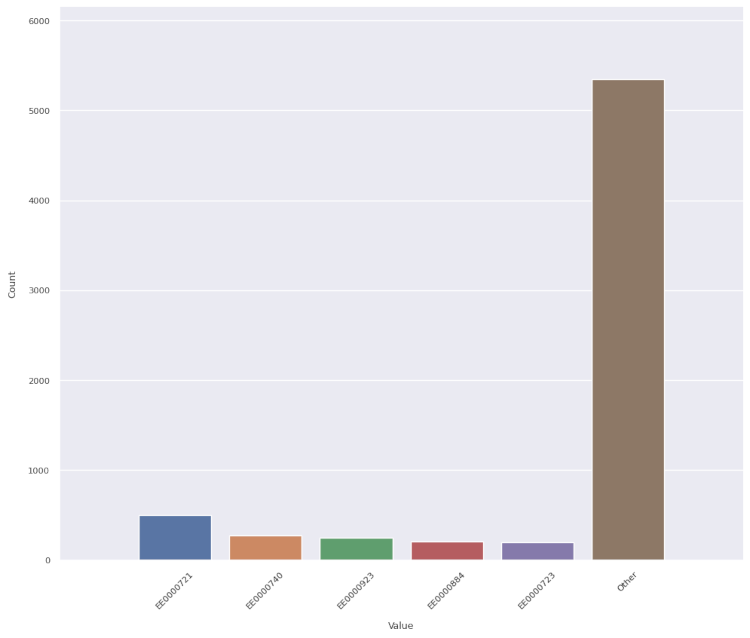
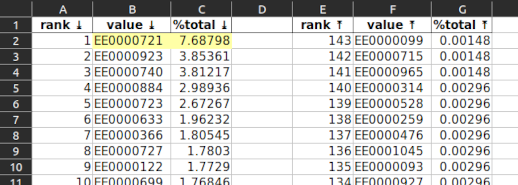
One employee (EE0000721) among the 143 who performed inspections handled one out of every fourteen inspections. And it was twice as many as the next busiest inspector. Why?
activity_date
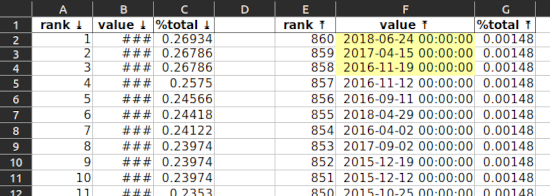
Note the dates with very few inspections (F2, F3, F4 …). These are Saturdays and Sundays. It makes sense inspectors (city staff) don’t work as much on weekends.
facility_name
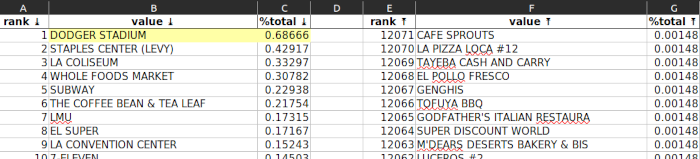
Again, “DODGER STADIUM” leads the way. Are there more restaurants in Dodger Stadium than there are Subway restaurants in all of Los Angeles?
owner_name
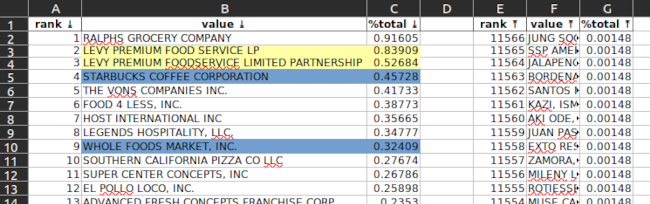
Note the yellow-highlighted cells. This looks to be a data-quality issue … Levy Premium Food listed twice. When added together this would be the top owner, not Ralph’s.
Note the blue-highlighted cells. Is true there are only 50% more Starbucks than Whole Foods?
service_description
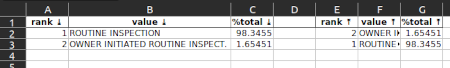
Only 1.65% of inspections were initiated by the owner. Probably makes sense.
All inspections are some variation of “routine”, apparently.
Potential improvements
Generate better plots. It is difficult to generate useful plots.
For example, you might want a categorical plot for character data, but if the column contains customer names then every name will appear (roughly) one time.
Or, you might want a histogram for numeric or datetime data, but if the column is a primary key, or a created timestamp generated by a trigger, then again each value will appear (almost always) one time.
Allow specification of plot visual effects.
When reading from a file:
Allow the specification of unusual, but known, datetime formats.
Allow the specification of columns to exclude, or include.